
Understanding your customers isn’t just a nice-to-have, it’s a must-have. Measuring customer experience provides you with the insights you need to create happier customers, better loyalty, and ultimately better business results.
But many organizations struggle to grasp the full picture of their customer experience. Without the right metrics in place, you’re essentially flying blind, and missing out on valuable opportunities to improve and innovate.
In this article, we’ll dive deep into the top 10 customer experience metrics you should be tracking. We’ll explore what they are, why they matter, and how you can leverage them to transform your business. Plus, we’ll show you how Kapiche can help you make sense of these metrics with ease.
What are Customer Experience Metrics?
Customer experience metrics are the key performance indicators (KPIs) that businesses use to gauge the quality of their interactions with customers. These customer experience metrics provide quantifiable data on aspects of the customer journey, from initial contact through to ongoing support and loyalty.
Why are these metrics so crucial? Because without them, you’re relying on your gut to tell if customers are happy.
Instead, you want to look at tangible indicators like repeat purchases, online reviews, and the time it takes to fulfill your product or service.
For businesses in B2B and B2C alike, they help you:
Identify Trends: Spot patterns in customer behaviour and feedback.
Make Informed Decisions: Base strategies on data rather than assumptions.
Measure Success: Evaluate the effectiveness of your initiatives and campaigns.
Drive Improvements: Implement changes that directly impact customer satisfaction and loyalty.
Let’s dive into the top 10 customer experience metrics that every insights leader should track to stay ahead of the competition.
Top 10 Customer Experience Metrics
1. Net Promoter Score (NPS)
Net Promoter Score (NPS) measures customer loyalty by asking a simple question: "On a scale of 0-10, how likely are you to recommend our product/service to a friend or colleague?" Customers are categorized into three groups: Promoters (9-10), Passives (7-8), and Detractors (0-6).
A high NPS indicates strong customer loyalty, leading to word-of-mouth referrals and long-term business growth. For example, a software company with a high NPS might see an increase in trial sign-ups due to positive referrals.
How to calculate NPS:
NPS = % of Promoters - % of DetractorsFor example, if 70% of respondents are Promoters and 10% are Detractors, the NPS would be 60.
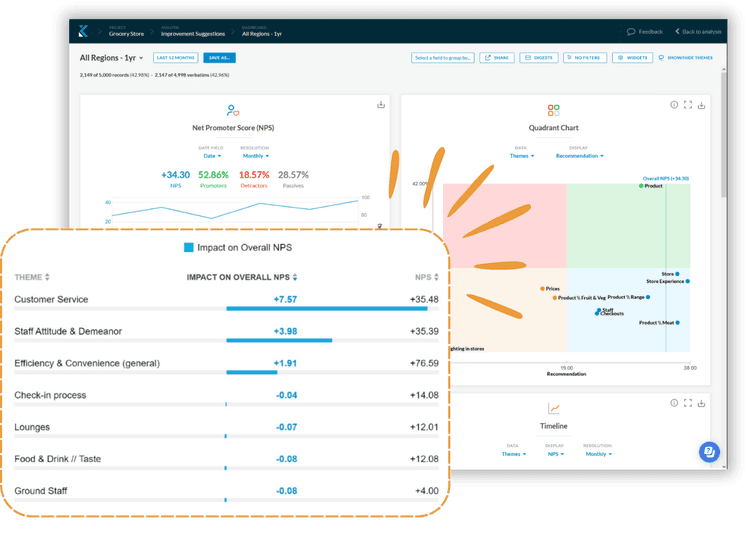
Calculating NPS with Kapiche
Kapiche helps you track NPS trends over time with its intuitive dashboard. By integrating survey data directly into the platform, you can see how changes in your service or product impact customer loyalty immediately.
2. Customer Satisfaction (CSAT)
Customer Satisfaction (CSAT) measures how satisfied customers are with a specific interaction or overall experience. This is typically assessed through a survey question like, “How would you rate your overall satisfaction with our service?”
A customer service metric, such as CSAT, is crucial for assessing customer experience and service efficiency.
A retail chain, for example, might use CSAT to gauge satisfaction with the checkout process. High CSAT scores could indicate efficient service, while low scores might highlight issues that need addressing.
How to calculate CSAT:
CSAT = (Sum of All Scores / Number of Respondents) * 100For example, if the total score is 400 out of 500 possible points, the CSAT score would be 80%.
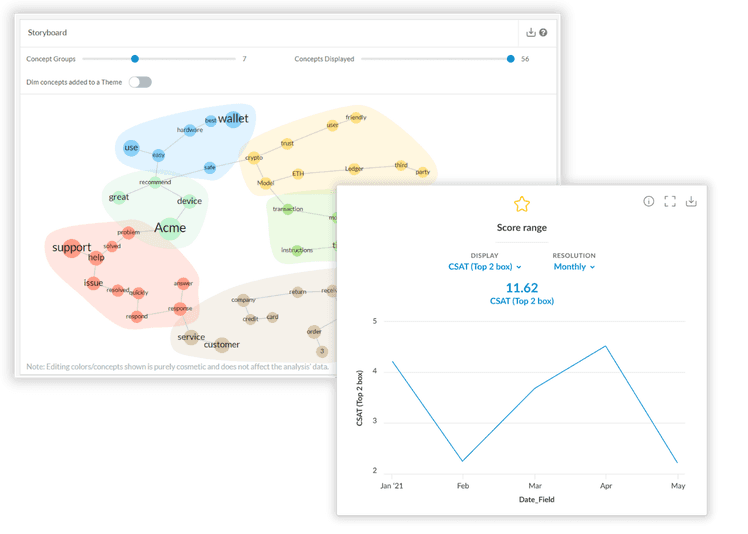
Calculating CSAT with Kapiche
Kapiche allows you to analyze CSAT data alongside qualitative feedback, giving you a deeper understanding of the drivers behind customer satisfaction. This holistic view helps in implementing targeted improvements.
3. Customer Effort Score (CES)
Customer Effort Score (CES) measures how easy it is for customers to get a resolution to their issues. The question typically asked is, "How much effort did you personally have to put forth to handle your request?"
For example, a telecom company might use CES to measure the ease of resolving billing issues. Lower scores indicate that customers find it hard to get help, potentially leading to frustration and churn.
How to calculate CES:
CES = Average Score from All Responses. For instance, if the average score from respondents is 2 out of 5, the CES is 2.
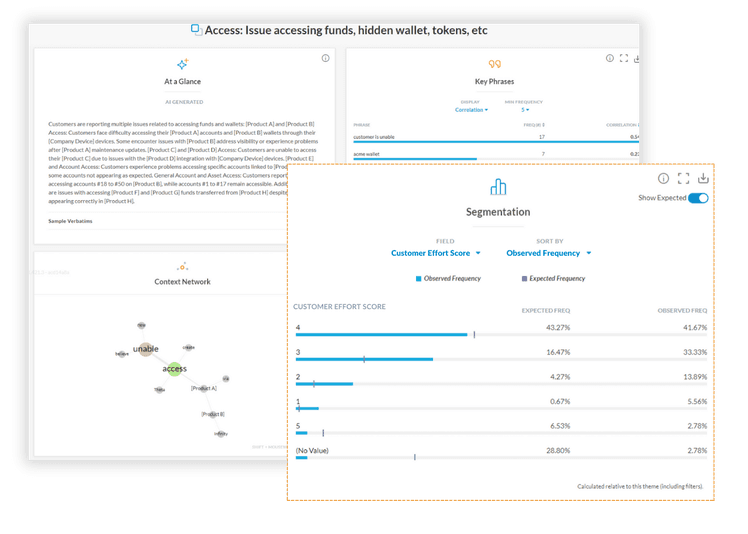
Calculating CES with Kapiche
Kapiche can track and monitor CES, helping you identify friction points in the customer journey. With AI-powered insights, you can quickly address these issues to enhance the customer experience.
4. Customer Lifetime Value (CLV)
Customer Lifetime Value (CLV) estimates the total revenue a business can expect from a single customer account over the lifetime of the relationship.
For example, a subscription service might use CLV to determine how much to invest in customer acquisition. Higher CLV indicates more profitable customers, justifying higher marketing spend.
How to calculate CLV:
CLV = (Average Purchase Value x Number of Purchases per Year) x Average Customer Lifespan
For example, if a customer spends $100 per purchase, makes 5 purchases a year, and remains a customer for 10 years, the CLV is $5,000.
Calculating CLV with Kapiche
Kapiche helps in calculating CLV by understanding customer purchase behaviour. It identifies key factors that increase customer value, allowing you to tailor strategies to enhance retention and profitability.
5. Customer Retention Rate
Customer Retention Rate measures the percentage of customers a company retains over a specific period.
For example, a SaaS company might track retention rates to understand how many users continue to renew their subscriptions. High retention rates indicate customer satisfaction and product value. Maintaining a low churn rate is crucial to foster loyal customers, as it is significantly more cost-effective to retain existing customers than to acquire new ones. Metrics such as retention rate and Customer Effort Score (CES) are directly connected to customer loyalty, with loyal customers tending to repurchase and refer others at higher rates.
How to calculate Customer Retention Rate:
Retention Rate = ((Number of Customers at End of Period - Number of New Customers Acquired) / Number of Customers at Start of Period) * 100
For instance, if you start with 200 customers, acquire 50 new ones, and end with 220, the retention rate is 85%.
Understanding Customer Retention Rate with Kapiche
Kapiche enables you to understand the reasons behind why customers stay or leave. This comprehensive view helps in crafting strategies to boost retention.
6. Customer Churn Rate
Customer Churn Rate measures the percentage of customers who stop using your product or service during a given time period.
An e-commerce platform might use churn rate to assess the effectiveness of its retention strategies. High churn rates signal underlying issues that need addressing.
How to calculate Customer Churn Rate:
Churn Rate = (Number of Customers Lost During Period / Total Number of Customers at Start of Period) * 100
If you start with 300 customers and lose 30 during the period, the churn rate is 10%.
Calculating Customer Churn Rate with Kapiche
Kapiche helps you to identify patterns and reasons behind customer attrition. With these insights, you can implement targeted retention efforts to reduce churn.
7. First Contact Resolution (FCR)
First Contact Resolution (FCR) measures the percentage of customer inquiries or issues resolved during the first contact.
A customer support center might track FCR to evaluate the efficiency of their service team. Higher FCR rates indicate better customer service and operational efficiency.
How to calculate FCR:
FCR = (Total Number of Cases Resolved on First Contact / Total Number of Cases) * 100
For example, if you resolve 80 out of 100 cases on the first contact, the FCR is 80%.
Calculating FCR with Kapiche
Kapiche integrates support ticket data to support your team in understanding and tracking FCR rates. By analyzing this alongside customer feedback, you can identify areas for improving first-contact resolutions.
8. Average Resolution Time (ART)
Average Resolution Time (ART) measures the average time it takes to resolve a customer issue or inquiry.
A tech support team might use ART to assess how quickly they are resolving technical issues. Lower ART indicates faster resolution times, improving customer satisfaction.
How to calculate ART:
ART = Total Resolution Time for All Cases / Total Number of Cases
If the total resolution time for 100 cases is 500 hours, the ART is 5 hours.
Calculating ART with Kapiche
Kapiche allows you to track and analyze data directly impacting ART. Identifying bottlenecks to resolving customer issues, and prioritizing areas for process improvement. Regularly monitoring this data helps to lower resolution times and enhance overall customer experience.
9. Customer Sentiment
Customer sentiment measures the overall emotional tone of your customer feedback. You can get a gauge of how customers really feel about you by monitoring data from surveys, reviews, and social media, among other channels.
A retail brand might use sentiment analysis to understand how customers feel about a new product launch. Tracking positive sentiment gives clues on what elements stand out for customers, and keeping an eye on themes connected to negative sentiment is helpful for iterating product features over time.
How to calculate Customer Sentiment:
Sentiment can be calculated in a myriad of ways, as it includes a blend of channels and factors depending on what you're looking to measure. The best approach to calculating sentiment is to get set up with a tool that can categorize feedback as positive, neutral, or negative, and provide you with a sentiment score.
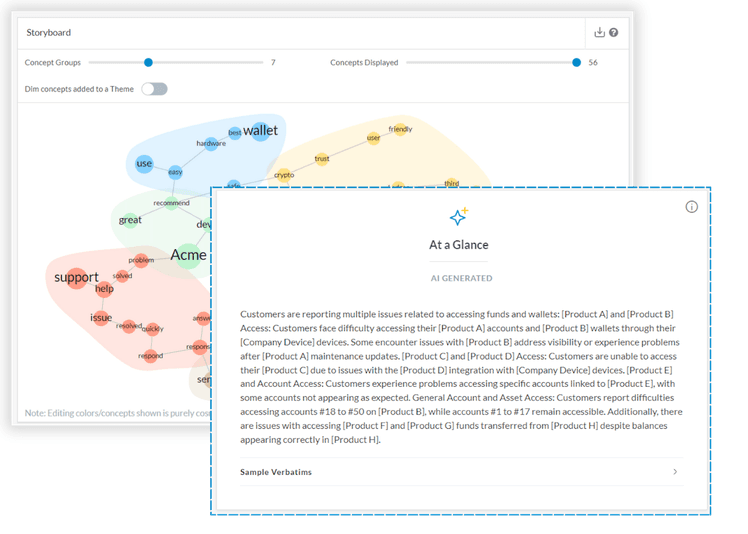
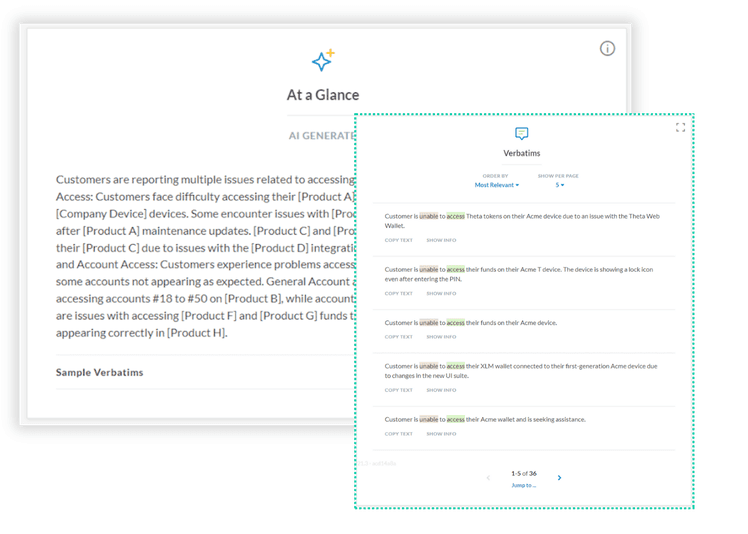
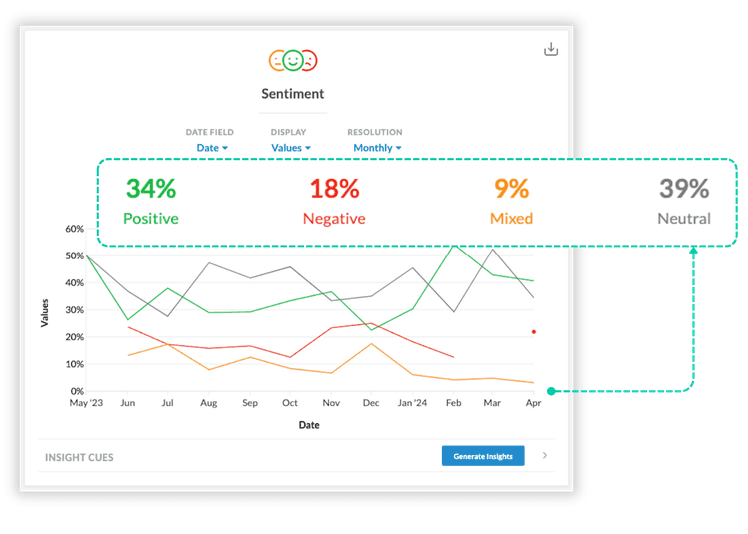
Calculating Customer Sentiment with Kapiche
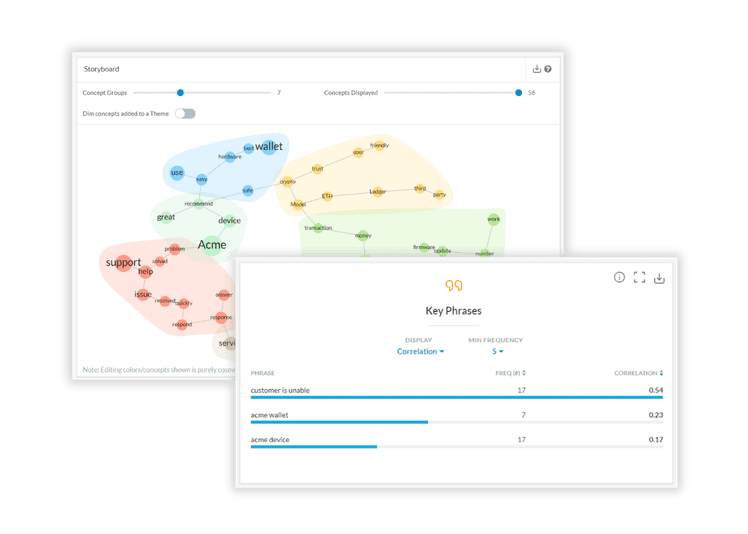
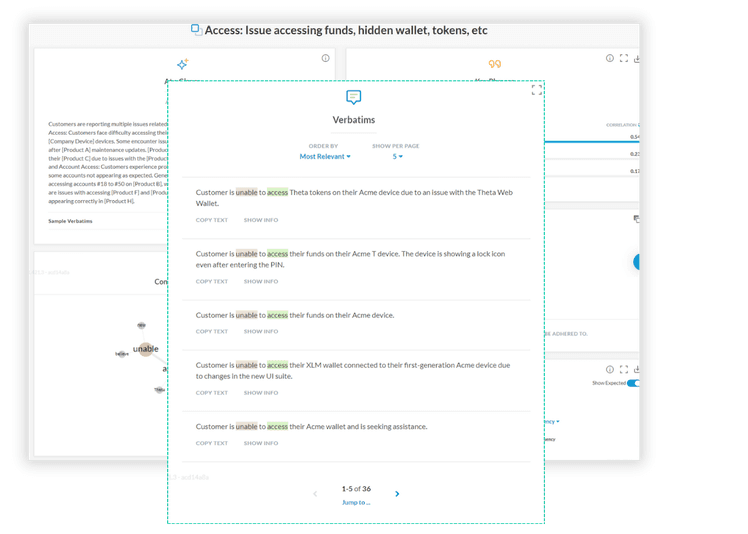
Kapiche uses AI-powered NLP to perform sentiment analysis on customer feedback, providing a clear picture of customer experiences with your brand, product or service. This helps you tailor strategies to improve customer sentiment over time.
10. Customer Journey Analytics
Customer Journey Analytics tracks the entire customer journey across various touchpoints, from initial contact to post-purchase interactions.
An online retailer might use customer journey analytics to understand how customers navigate their website, identifying pain points that cause cart abandonment.
How to calculate Customer Journey Analytics:
Similar to sentiment, customer journey analytics include a litany of touchpoints across the customer buying journey. To track and measure these effectively, you’ll want to engage a tool to help you map out each touchpoint and understand key metrics at each stage – from conversion rates, drop-off points, and customer satisfaction.
Calculating Customer Sentiment with Kapiche
Kapiche's platform helps to understand comprehensive customer journeys, integrating data from multiple sources to give a complete view of the customer experience. This helps in optimizing each touchpoint to enhance the overall journey.
How to Improve Your CX Metrics
Improving your customer experience metrics is essential for staying competitive and maintaining customer satisfaction.
Here are a few practical steps you can take to enhance your CX metrics:
1. Understand your data
Make sure you're collecting data from multiple touch points across the customer journey – like surveys, social media, and support tickets. Using both qualitative and quantitative methods helps to gather an unbiased cross-section of insights across your customer base.
2. Prioritize key metrics
Identify which CX metrics have the most significant impact on your business outcomes. Prioritize improving those metrics first for the best ROI on your efforts. You'll want to establish specific, measurable goals for each area you want to improve – like aiming to increase your Net Promoter Score (NPS) by 10 points within the next quarter.
3. Act on your insights
As you gather insights, make sure they move you towards action. If you need to work on getting buy-in across your team, aim to implement changes on a small scale and monitor the impact on your CX metrics as you work up to bigger initiatives.
4. Foster a customer-centric culture
Make sure that that everyone from the C-suite to the newest hire understands the importance of customer experience, and their role in improving it. Doing this well looks like promoting cross-functional collaboration, and communicating across disciplines. Your marketing, sales, and support teams for example should understand how customers are experiencing touch points throughout the journey.
5. Use tools to accelerate impact
AI-powered feedback analytics tools like Kapiche can help you get to deeper insights fast, uncovering the 'unknown, unknowns' of customer behaviour and sentiment. Look for an NLP-enabled platform to help you quickly identify hidden patterns and make data-driven decisions.
FAQs
What are customer experience metrics?
Customer experience metrics are key performance indicators (KPIs) that teams use to measure and understand the quality of interactions between customers and the company. These metrics provide insights into how customers perceive their experiences and help businesses identify areas for improvement. Effectively monitoring and improving customer experience metrics leads to improved customer satisfaction, loyalty, and retention.
What are the best KPIs to measure customer experience?
The KPIs for customer experience typically include: Net Promoter Score (NPS), Customer Satisfaction Score (CSAT), Customer Effort Score (CES), Customer Lifetime Value (CLV), Customer Retention Rate, Customer Churn Rate, First Contact Resolution (FCR), Average Resolution Time, Customer Sentiment Analysis, and Customer Feedback Response Rate.
In summary
At this point, you’re likely buzzing with ideas on how to harness the power of customer experience metrics on your team. If you're looking for a tool to help in your measurement efforts, Kapiche is designed to make CX measurement seamless.
Kapiche acts as your partner in creating outstanding customer experiences. With Kapiche, you can:
Track and Improve Key Metrics: Understand and enhance your NPS, CSAT, CES, and other critical customer experience metrics.
Gain Deeper Insights: Dive deep into customer feedback and uncover the underlying sentiments and drivers behind your scores.
Act on Data-Driven Insights: Move beyond mere data collection and start making informed decisions that lead to tangible improvements in customer satisfaction and loyalty.


