Customer retention is the lifeblood of any successful business.
But without the right metrics, you're flying blind. You need to know precisely how well you keep customers loyal, engaged, and returning for more.
In this post, we'll dive into 11 essential customer retention metrics that every business should track. From the classic retention rate to more advanced measures like customer health scores, you'll learn what each metric means, how to calculate it, and, most importantly, how to use it to boost your bottom line.
Ready to take your customer retention strategy to the next level? Let's get started.
What are Customer Retention Metrics?
Customer retention metrics measure how well a business keeps customers over time.
These metrics provide insights into customer loyalty, satisfaction, and overall relationship health.
Tracking retention metrics helps identify areas for improvement, measure strategy effectiveness, and predict future revenue.
Businesses should track several key customer retention metrics to gain a comprehensive understanding of their customer relationships.
Importance of Tracking Customer Retention Metrics
Tracking customer retention metrics is essential for several reasons:
Identify Areas for Improvement in Customer Experience
By closely monitoring retention metrics, businesses can pinpoint specific areas where the customer experience falls short. This may include issues with product quality, customer service, pricing, or overall value. By identifying these pain points, companies can take targeted actions to improve the customer experience and increase retention.
Measure the Effectiveness of Customer Retention Strategies
Retention metrics provide a clear picture of how well a business's current strategies are keeping customers engaged and loyal. By tracking these metrics over time, companies can assess the impact of specific initiatives, such as loyalty programs, personalized communications, or product improvements. This data-driven approach allows businesses to refine their retention strategies for maximum effectiveness.
Predict Future Revenue and Growth
Customer retention directly impacts a company's bottom line. By analyzing retention metrics alongside other financial data, businesses can create more accurate forecasts for future revenue and growth. This information is invaluable for strategic planning, resource allocation, and investor relations. Additionally, by focusing on improving retention, companies can often achieve more sustainable growth than by solely focusing on new customer acquisition.
11 Must-Know Customer Retention Metrics
Tracking the right customer retention metrics is crucial for understanding and improving customer loyalty.
Each metric offers unique insights into customer behavior and satisfaction, helping businesses make data-driven decisions.
By monitoring these 11 metrics, companies can identify areas for improvement and take action to reduce churn and increase customer lifetime value.
1. Customer Retention Rate
The customer retention rate measures the percentage of customers a business retains over a given period. This metric is calculated by dividing the number of customers at the end of a period by the number of customers at the beginning, excluding any new customers acquired during that time. A high retention rate indicates that customers are satisfied and loyal, while a low rate suggests issues with the product, service, or overall customer experience.
How To Calculate Customer Retention Rate
To calculate the customer retention rate, you can use the following formula:
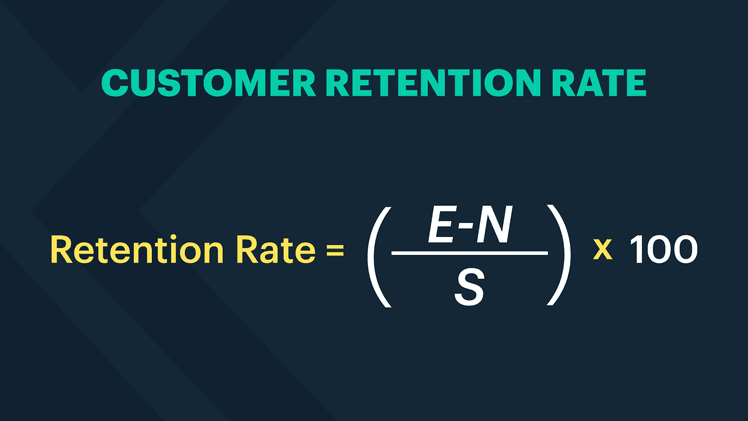
Customer Retention Rate=((𝐸−𝑁)/𝑆)×100
E is the number of customers at the end of the period.
N is the number of new customers acquired during the period.
S is the number of customers at the start of the period.
Hypothetical Scenario: Retention Rate Calculation
Let's consider a hypothetical business, "StreamFlix," a video streaming service which wants to calculate its customer retention rate for the month of June.
Starting Customers (S): At the beginning of June, Tech Solutions Inc. had 150 customers.
New Customers Acquired (N): During June, the company acquired 30 new customers.
Ending Customers (E): By the end of June, the company had 160 customers.
Plugging it into our formula, this looks like: ((160 - 30)/150 x 100 = 86.67%
The customer retention rate for StreamFlix for the month of June is 86.67%. This means that 86.67% of the customers who were with the company at the start of June remained with the company by the end of the month.
Interpreting Retention Rates
An 86.67% retention rate indicates that a significant majority of customers are satisfied with the company's products or services and choose to continue their relationship with the business. This is a positive sign of customer loyalty and satisfaction. It's always good to compare your retention rate with industry benchmarks. If the industry average retention rate was around 90% for example, the company might need to investigate areas for improvement. Conversely, if the industry average is lower, the company is performing well relative to its peers.
2. Customer Churn Rate
The customer churn rate is the opposite of the retention rate, measuring the percentage of customers a business loses over a given period. This metric is calculated by dividing the number of customers lost during a period by the total number of customers at the beginning of that period. A high churn rate indicates that customers are dissatisfied or finding better value elsewhere, while a low churn rate suggests a strong, loyal customer base.
How To Calculate Customer Churn Rate
The formula for calculating customer churn rate is:

Where:
L is the number of customers lost during the period.
S is the number of customers at the start of the period.
Hypothetical Scenario: Churn Rate Calculation
Let's consider our hypothetical business, "StreamFlix," again, which wants to calculate its customer churn rate for the month of July.
Starting Customers (S): At the beginning of July, StreamFlix had 10,000 subscribers.
Customers Lost (L): During July, 450 subscribers canceled their service.
Ending Customers: By the end of July, the company had 9,550 subscribers (not directly used in the calculation, but helpful for context).
Plugging it into our formula, this looks like: (450 / 10,000) x 100 = 4.5%
The customer churn rate for StreamFlix for the month of July is 4.5%. This means that 4.5% of the subscribers who were with the company at the start of July canceled their subscriptions by the end of the month.
Interpreting Churn Rates
A 4.5% monthly churn rate might seem small, but it can have significant implications:
If this rate continues, StreamFlix would lose about 54% of its current customer base over a year (1 - (1 - 0.045)^12 ≈ 0.54).
To maintain its customer base, StreamFlix needs to acquire at least 450 new customers each month to replace those lost.
To grow, the company needs to acquire more than 450 new customers monthly.
3. Customer Lifetime Value (CLV)
Customer lifetime value (CLV) represents the total revenue a business can expect from a single customer throughout its relationship with the company. This metric factors in the average purchase value, purchase frequency, and customer lifespan. By understanding CLV, businesses can make informed decisions about customer acquisition costs, retention strategies, and overall customer profitability.
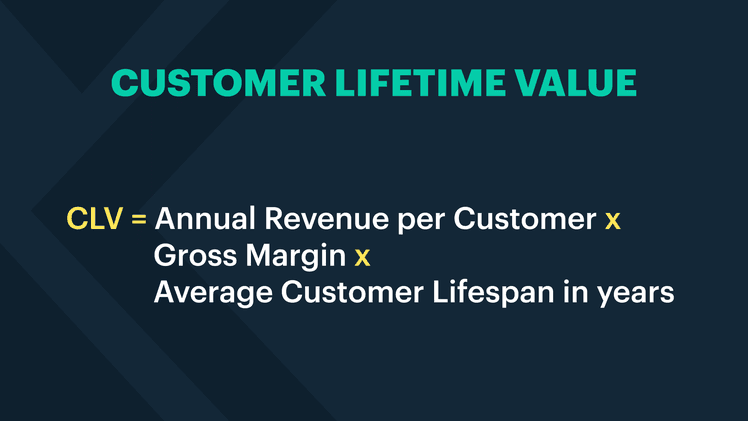
How To Calculate Customer Lifetime Value
The formula for calculating customer lifetime value is:
Hypothetical Scenario: Customer Lifetime Value Calculation
Continuing our hypothetical example, say StreamFlix wants to calculate its Customer Lifetime Value. They offer a monthly subscription model and have been in business for several years.
Given Data:
Average Monthly Subscription Fee: $15
Average Customer Lifespan: 24 months
Gross Margin: 70%
Customer Acquisition Cost (CAC): $50
Plugging it into our formula, this looks like:
Calculate Annual Revenue per Customer: $15 per month × 12 months = $180 per year
Calculate Customer Value: Annual Revenue × Gross Margin$180 × 0.70 = $126 per year
Calculate Customer Lifetime Value: Customer Value × Average Customer Lifespan (in years)$126 × (24 months / 12 months) = $252
Interpreting Customer Lifetime Value
A CLV of $252 indicates that, on average, each customer is expected to generate $252 in gross profit over their entire relationship with StreamFlix. This provides a clear picture of the long-term value each customer brings to the company.
With a CLV of $252 and a Customer Acquisition Cost (CAC) of $50, StreamFlix has a CLV:CAC ratio of about 5:1. This is generally considered healthy, as it's above the recommended minimum of 3:1. It suggests that StreamFlix can afford to invest more in customer acquisition if needed.
4. Net Promoter Score (NPS)
Net Promoter Score (NPS) is a metric used to measure customer loyalty and satisfaction by asking customers how likely they are to recommend a company's product or service to others. The score is typically between -100 to 100, as a measure of satisfaction. The responses are categorized into three groups: Promoters, Passives, and Detractors.
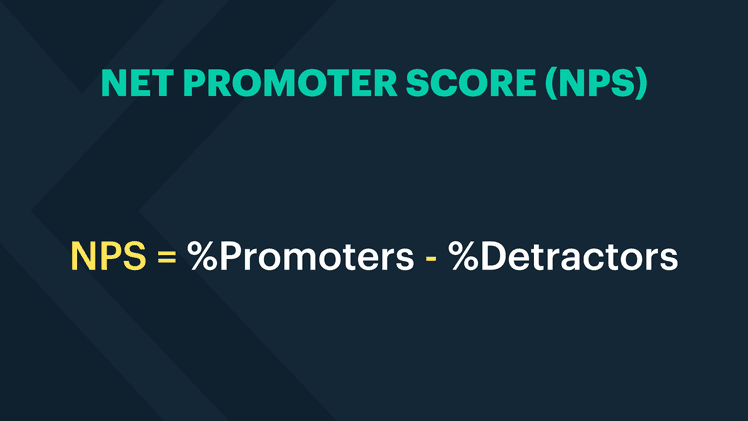
How To Calculate Net Promoter Score
The formula for calculating NPS is:
Where:
Promoters are customers who respond with a score of 9 or 10.
Passives are customers who respond with a score of 7 or 8 (not used in the calculation).
Detractors are customers who respond with a score between 0 and 6.
Hypothetical Scenario: NPS Calculation
Let's consider "Tech Solutions Inc.," a software company that wants to calculate its NPS based on customer feedback collected in June.
Given Data:
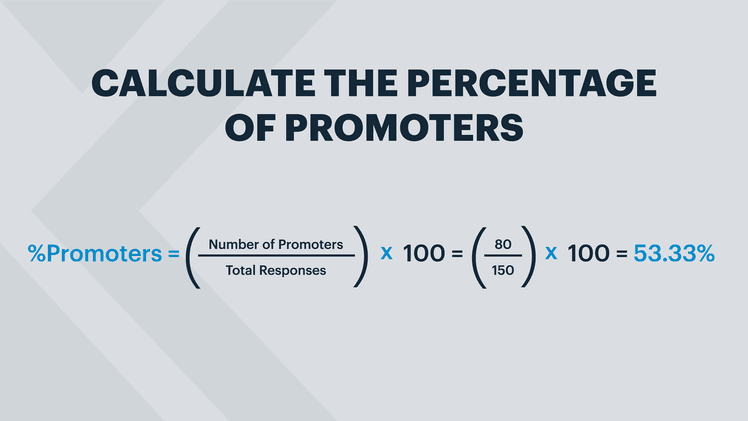
Total number of survey responses: 150
Number of Promoters (scores 9-10): 80
Number of Passives (scores 7-8): 30
Number of Detractors (scores 0-6): 40
Plugging this into our formula, this looks like:
Calculate the percentage of Promoters:
2. Calculate the percentage of Detractors:
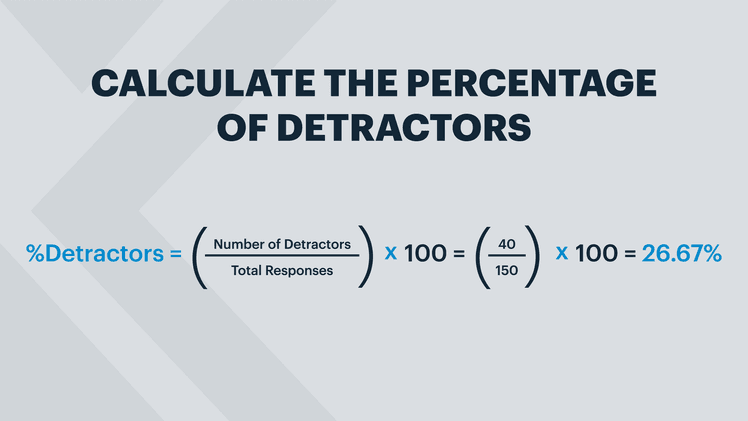
3. Calculate the NPS:
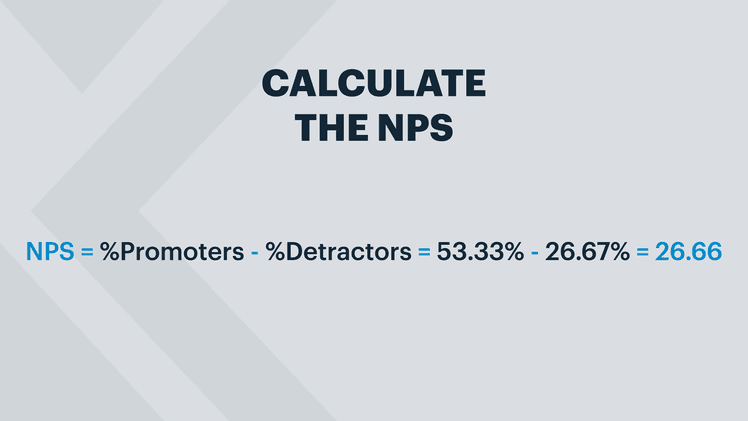
Therefore, the Net Promoter Score for Tech Solutions Inc. is 26.66.
Interpreting Net Promoter Score (NPS)
An NPS of 26.66 indicates that Tech Solutions Inc. has more promoters than detractors, suggesting a generally positive customer sentiment. However, the company still needs to address a significant portion of detractors. The presence of 26.67% detractors indicates areas where the company can improve. Conducting follow-up surveys or interviews with detractors can provide insights into specific issues that need to be addressed.
5. Repeat Purchase Rate
Repeat purchase rate is the percentage of customers who make more than one purchase from a company over a given period. This metric indicates the level of customer satisfaction and loyalty, as well as the effectiveness of a company's retention marketing efforts. It's a key metric for assessing customer loyalty and the effectiveness of retention strategies.
How To Calculate Repeat Retention Rate
The formula for calculating NPS is:
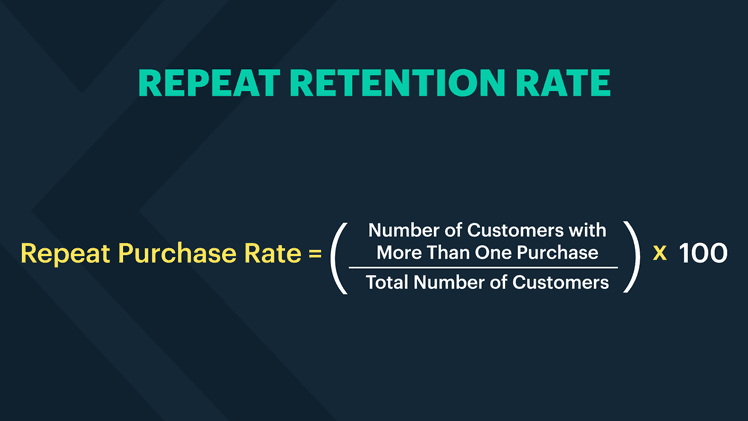
Hypothetical Scenario: Repeat Purchase Rate Calculation
Let's consider "GreenGrow Garden Supplies," an online retailer of gardening products, which wants to calculate its Repeat Purchase Rate for the second quarter of the year.
Given Data:
Total number of unique customers who made a purchase in Q2: 5,000
Number of customers who made more than one purchase in Q2: 1,250
Plugging it into our formula, this looks like: RPR = (1,250 / 5,000) x 100 = 25%
Therefore, the Repeat Purchase Rate for GreenGrow Garden Supplies in Q2 is 25%.
Interpreting Repeat Purchase Rate
A 25% RPR indicates that one out of every four customers made repeat purchases within the quarter. This suggests a moderate level of customer loyalty and satisfaction with GreenGrow's products or services. With 75% of customers not making repeat purchases in the quarter, there's a significant opportunity for GreenGrow to improve its RPR. This could involve strategies like personalized follow-ups, loyalty programs, or targeted promotions.
6. Time Between Purchases
Time Between Purchases, also known as Purchase Frequency or Inter-Purchase Time, measures the average duration between consecutive purchases made by the same customer. This metric helps businesses understand customer buying patterns and engagement levels.
How To Calculate Time Between Purchases
The formula for calculating TBP is:
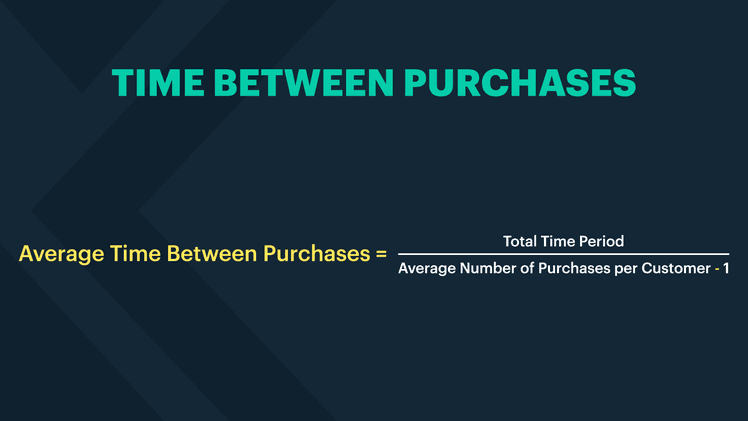
Hypothetical Scenario: Time Between Purchases Calculation
Let's consider "FreshFit Meal Delivery," a subscription-based meal kit service that wants to calculate its Average Time Between Purchases for the past year.
Given Data:
Total time period: 365 days (1 year)
Total number of customers who made at least two purchases: 5,000
Total number of purchases made by these customers: 35,000
Plugging it into our formula, this looks like:
Average Purchases per Customer = 35,000 / 5,000 = 7 purchases
Average Time Between Purchases = 365 / 7-1 = 60.83 days
Therefore, the Average Time Between Purchases for FreshFit Meal Delivery is approximately 61 days.
Interpreting Time Between Purchases
An average of 61 days between purchases indicates moderate engagement. For a meal kit service, this might suggest that customers are using the service roughly every two months. This insight provides opportunities for targeted marketing. FreshFit could send reminders or special offers to customers around day 50-55 after their last purchase to encourage reordering. Knowing that customers typically order every 61 days can help FreshFit optimize its inventory and supply chain management.
7. Product Return Rate
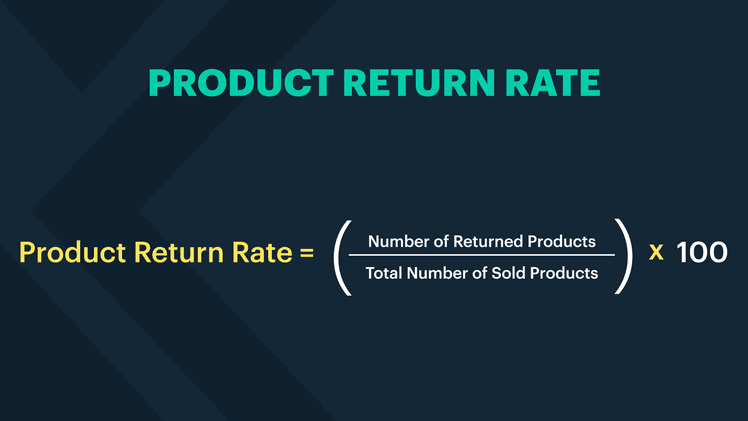
Product Return Rate measures the percentage of products that customers return after purchase. This metric is crucial for understanding product quality, customer satisfaction, and the effectiveness of the sales process.
How To Calculate Product Return Rate
The formula for calculating the Product Return Rate is:
Hypothetical Scenario: Product Return Rate Calculation
Let's consider "TechGadgets Inc.," an electronics retailer that wants to calculate its Product Return Rate for the last quarter.
Given Data:
Total number of products sold in the last quarter: 10,000
Total number of products returned in the last quarter: 500
Plugging this into our formula, this looks like: Product Return Rate = (500 / 10,000) x 100 = 5%
Interpreting Product Return Rate
High return rates can indicate low customer satisfaction. TechGadgets Inc. should investigate the reasons behind the returns to identify and address any recurring issues. A 5% return rate could indicate issues with product quality, defects, or customer dissatisfaction.
8. Existing Customer Revenue Growth Rate
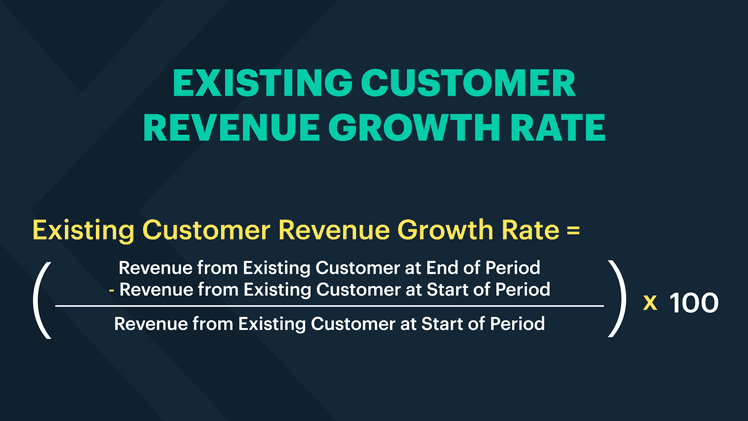
Existing Customer Revenue Growth Rate measures the increase in revenue generated from existing customers over a specific period. This metric helps businesses understand how effectively they are upselling, cross-selling, and retaining their current customer base.
How To Calculate Existing Customer Revenue Growth Rate
The formula for calculating customer revenue growth rate is:
Hypothetical Scenario: Existing Customer Revenue Growth Rate Calculation
Let's consider TechGadgets Inc., an electronics retailer that wants to calculate its last quarter's Existing Customer Revenue Growth Rate.
Given Data:
Revenue from existing customers at the start of the quarter: $500,000
Revenue from existing customers at the end of the quarter: $600,000
Plugging this into our formula, this looks like: Existing Customer Revenue Growth Rate = (600,000 - 500,000 / 500,000) x 100 = 20%
Therefore, the Existing Customer Revenue Growth Rate for TechGadgets Inc. in the last quarter is 20%.
Interpreting Existing Customer Revenue Growth Rate
A 20% growth rate indicates that TechGadgets Inc. successfully increased its revenue from existing customers by 20% over the quarter. This is a positive sign of effective upselling and cross-selling strategies. This metric is closely tied to customer retention and loyalty. Growing revenue from existing customers often indicates that customers are not only staying but also investing more in the company's offerings.
9. Revenue Churn Rate
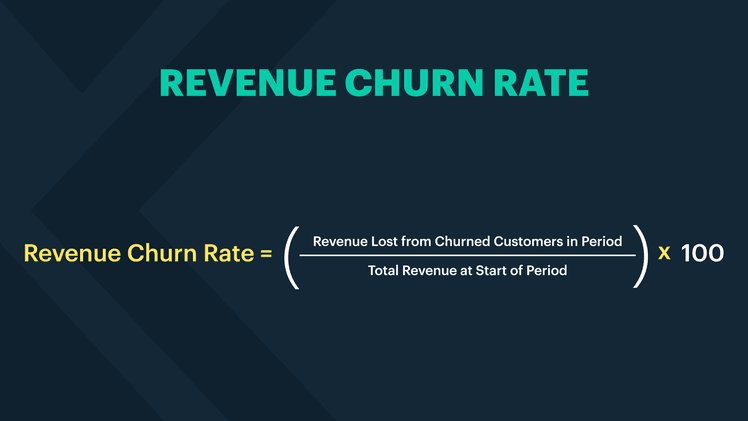
Revenue Churn Rate measures the percentage of revenue lost from existing customers over a specific period. This metric is crucial for subscription-based businesses to understand the financial impact of customer churn.
How To Calculate Revenue Churn Rate
The formula for calculating Revenue Churn Rate is:
Hypothetical Scenario: Revenue Churn Rate Calculation
Let's consider "StreamFlix," a video streaming service that wants to calculate its Revenue Churn Rate for the last quarter.
Given Data:
Total revenue at the start of the quarter: $1,000,000
Revenue lost from churned customers during the quarter: $50,000
Plugging this into our formula, this looks like: Revenue Churn Rate = (500,000 / 1,000,000) x 100 = 5%
Therefore, the Revenue Churn Rate for StreamFlix in the last quarter is 5%.
Interpreting Revenue Churn Rate
A 5% Revenue Churn Rate indicates that StreamFlix lost 5% of its revenue from existing customers during the quarter. This directly impacts the company's bottom line and growth potential. For a subscription-based service like StreamFlix, a 5% quarterly Revenue Churn Rate (which could compound to nearly 20% annually) might be concerning and indicate issues with customer satisfaction or competitive pressures.
10. Loyal Customer Rate
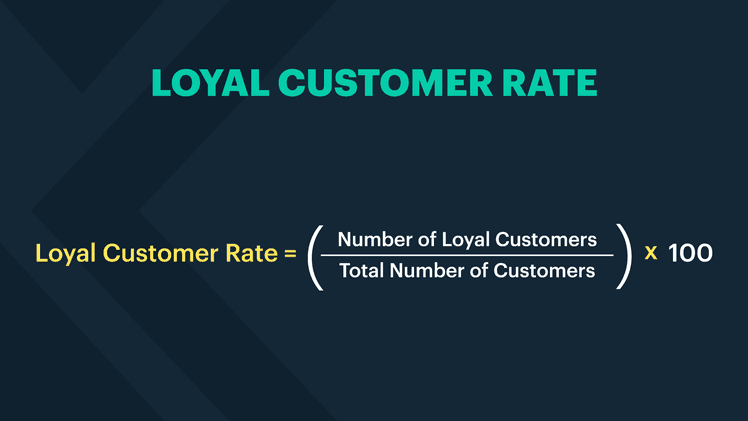
Loyal Customer Rate measures the percentage of customers who make repeat purchases over a specific period. This metric helps businesses understand the loyalty and retention of their customer base.
How To Calculate Loyal Customer Rate
The formula for calculating loyal customer rate is:
Hypothetical Scenario: Loyal Customer Rate Calculation
Let's consider "EcoHome Supplies," a retailer of eco-friendly home products, which wants to calculate its Loyal Customer Rate for the last year.
Given Data:
Total number of customers in the last year: 10,000
Number of loyal customers (customers who made at least three purchases): 2,500
Plugging this into our formula, this looks like: Loyal Customer Rate = (2,500 10,000) x 100 = 25%
Therefore, the Loyal Customer Rate for EcoHome Supplies in the last year is 25%.
Interpreting Loyal Customer Rate
A 25% Loyal Customer Rate indicates that one out of every four customers is making repeat purchases. This suggests a moderate level of customer loyalty and satisfaction with EcoHome Supplies' products. While 25% is a positive sign, there is room for improvement in encouraging more customers to become loyal. Loyal customers typically have a higher Customer Lifetime Value (CLV). A 25% Loyal Customer Rate suggests that a substantial portion of the customer base is likely to generate more revenue over time.
11. Customer Satisfaction Score (CSAT)
Customer Satisfaction Score (CSAT) measures how satisfied customers are with a company's products, services, or specific interactions. It is typically assessed through surveys where customers rate their satisfaction on a scale (e.g., 1 to 5 or 1 to 10).
How To Calculate Customer Engagement Score
The formula for calculating your customer satisfaction score is:
Hypothetical Scenario: Customer Engagement Score Calculation
Let's consider "SaaS Analytics Pro," a software company that provides analytics tools. They want to calculate their Customer Satisfaction Score for the last quarter based on a customer survey.
Given Data:
Total number of survey responses: 1,000
Number of satisfied customers (customers who rated 4 or 5 on a 5-point scale): 850
Plugging this into our formula, this looks like: Customer Satisfaction Rate = (850 / 1,000) x 100 = 85%
Therefore, the Customer Satisfaction Score for SaaS Analytics Pro in the last quarter is 85%.
Interpreting Customer Engagement Score
An 85% CSAT indicates that a significant majority of customers are satisfied with SaaS Analytics Pro's products or services. This is a positive sign of customer satisfaction and product quality. SaaS Analytics Pro should compare its CSAT with industry benchmarks. If the industry average is around 80%, an 85% score indicates that the company is performing well relative to its peers. While an 85% CSAT is good, it also means that 15% of customers are not fully satisfied. SaaS Analytics Pro should analyze feedback from these customers to identify areas for improvement.
How to Improve Customer Retention Using Metrics
Use retention metrics to identify trends and patterns
Develop targeted strategies based on customer segments
Continuously monitor and optimize retention efforts
Tracking customer retention metrics is just the first step in improving your business's ability to keep customers coming back. The real value lies in using these metrics to drive meaningful changes in your customer retention strategies. By analyzing and interpreting retention metrics, developing targeted retention strategies, and continuously monitoring and optimizing your efforts, you can turn data into action and see real improvements in customer loyalty.
Analyze and Interpret Retention Metrics
The first step in using retention metrics to improve customer retention is to regularly review and analyze the data you've collected. Look for trends and patterns in your metrics over time, such as changes in customer churn rate, lifetime value, or repeat purchase rate. Identify any significant shifts or outliers that may indicate areas where your retention efforts are succeeding or failing.
One effective way to analyze retention metrics is to segment your customers based on their retention performance. For example, you might group customers by their loyalty status (e.g., new, repeat, or long-term), their purchase frequency, or their engagement level with your brand. By comparing retention metrics across these segments, you can identify which groups of customers are most at risk of churning and which are most valuable to your business.
Example: Segmenting Customers by Purchase Frequency
Suppose you segment your customers into three groups based on their purchase frequency over the past year:
One-time buyers: Customers who made a single purchase
Occasional buyers: Customers who made 2-3 purchases
Frequent buyers: Customers who made 4 or more purchases